PDIS
The Generic Process Data Information System
PDIS is a PC based information system for process data collected from industrial plants (power generation, oil&gas, chemicals, etc.). The PDIS database is a Data Warehouse of process, laboratory and logistic data. Data transfer to the Data Warehouse is highly automated. The data can be imported from the most frequent industrial sources (PI, PHD, AIM*, Industrial SQL server and others), data files (text, Excel), but manual input via a keyboard is also enabled. PDIS can also serve as a simple and still powerful generic data presentation and analysis tool for the most frequent industrial historians like PHD (Honeywell), PI (OSIsoft) or other systems equipped with the OPC interface.
Raw process data can be complemented by so-called derived (calculated) variables, which are some functions of raw process data. This is done automatically during a raw data import on the basis of user–defined formulas (a Basic – like editor of equations). Such derived variables are saved to the PDIS DB as they were measured. Aside of these real derived variables there can be also so-called virtual derived variables which are not residing in the PDIS DB, but are calculated on request during some presentations (the on-fly method).
Data can be imported also with the aid of ChemPlant's data validation program Recon. In this way, aside of raw process data, also consistent reconciled data and data calculated by advanced thermodynamic and other models can be later available in the PDIS Database.
PDIS can manage data from small plants to large companies. Typical number of tags is in thousands or tens of thousands. Data can be used by many ways described below. There are two Graphical User Interfaces for data presentation available:
- a fat client - a MS Windows program running on a user's PC (the 2 layer approach)
- a thin client based on the MS Internet Browser (the 3 layer approach) suitable for Intranet/Internet access.
PDIS databases
In general, there exist two PDIS databases:
- database of Metadata – this is - "data about data". This is for example a list of tag names, groups of variables, screens, list of users, etc. Metadata are relatively stable, not changed frequently. The native relational DB for metadata is the MS SQL DB. As the Metadata DB size is usually moderate, the free MSDE (Express) version is sufficient (for number of tags in the range of tens of thousands).
- database of real time process data. Typical representatives of process data are snapshots of process variables, average values of process variables in specified time intervals (hours, shifts, days, etc.), inventories at some time etc. Also logical or text variables. The native relational DB for process data is the full MS SQL DB or the Oracle DB. For small data systems (for example up to 1000 of tags) also the free MSDE is possible.
Data presentation
In general, data can be presented in numerical or graphical form (time trends). The numerical data in the graphical form can be transferred by a single mouse-click into an Excel file table. For PDIS it is typical that in the area of data presentation, the individual users have the same possibilities as the administrator. They can create their private screens, reports, etc.
One important problem is "How to find data I am interested in?" The possibilities are as follows:
- a tree representing structure of a company
- groups of variables related to some problems
- tag names of variables
- screens typical for some areas or problems
- reports in the MS Excel format created either automatically or by some users and available on the company's LAN.
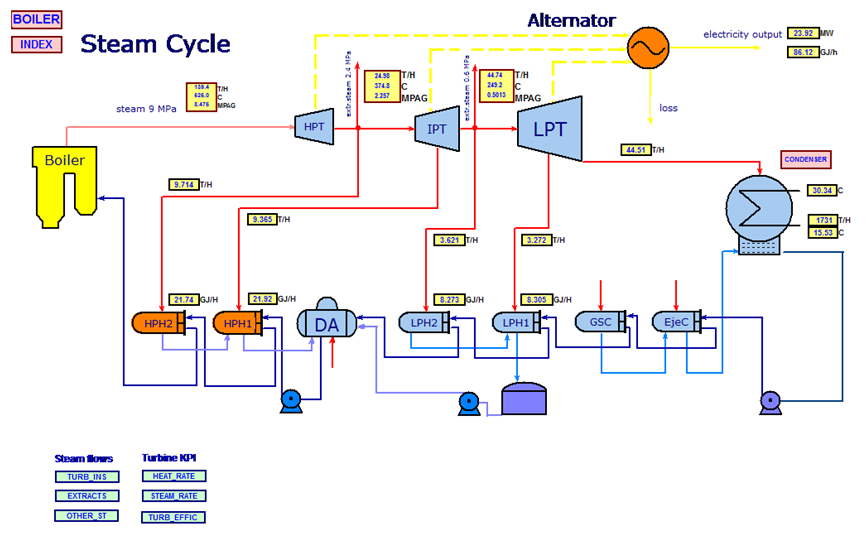
Screens
Screens are the most common way of data presentation. Screens are usually based on the underlying scheme (flowsheet) describing some part of a plant, production process, etc. On the flowsheet there are objects enabling access to data.
The following objects on screens are available in PDIS:
- navigation to other screens (doors).
- tags representing individual data. It is possible to view either tag names or values of process data at some specified time. By clicking on a tag a time trend of the variable appears on the screen.
- multitags showing up to 4 tags in a small table (typical for the power industry as FTPH information box - Flow/Temperature/Pressure/Enthalpy)
- groups of tags with some common attribute (data from some place, related to some process, etc.). Groups can be either common (shared and accessible by all users) or private (accessible by individual users). Common groups are managed by the administrator, the private groups are managed by individual users. By clicking on a group, a group of trends appears on the screen with further possibilities of editing trends.
- analog instruments - visualization of numerical data via classical instruments like thermometers or so, with alarms on limiting values.
- traffic lights - red and green lights showing some situations in the process (an apparatus is ON/OFF and the like).
- other objects used in Dashboards - see the Energy Management system at the end of this Document.
The underlying pictures (carpets) in screens can be either bitmaps copied from somewhere or created in some 3rd party software. There is also a special vector flowsheet editor included in PDIS. This editor includes a library of typical industrial apparatuses, instrumentation and other objects needed for such drawing.
Again, screens can be either common (available to all) or private (available to individual users).
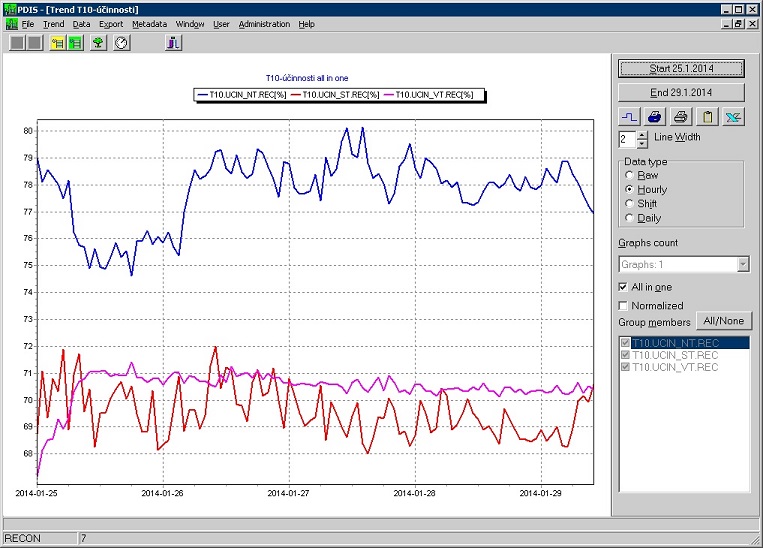
Trends
There are broad possibilities to configure trends of variables (graphs) as concerns the time interval, number of variables on one graph, etc. All trends can be either printed or transferred to other presentation tools (MS Word, MS Excel, etc.).
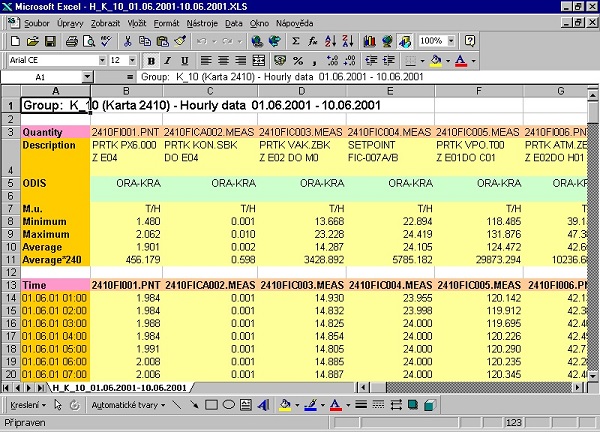
Data exports
All process data in the PDIS DB can be exported as Excel files. This can be done either from any trend screen (what you see you can export) or in a special menu on the basis of common or private groups). Exported files contain also basic statistical characteristics of exported time series.
Reporting
Reporting in PDIS is based on user-defined MS Excel templates, which can be either public or private. Reports can contain any functions, graphs or tables available in Excel. Each template contains links to the PDIS database. Reports can be created either on users' demand or automatically (for example at night) and distributed by means of the company LAN or Intranet. Created reports including their history can be presented via PDIS's screens or a special report viewer.
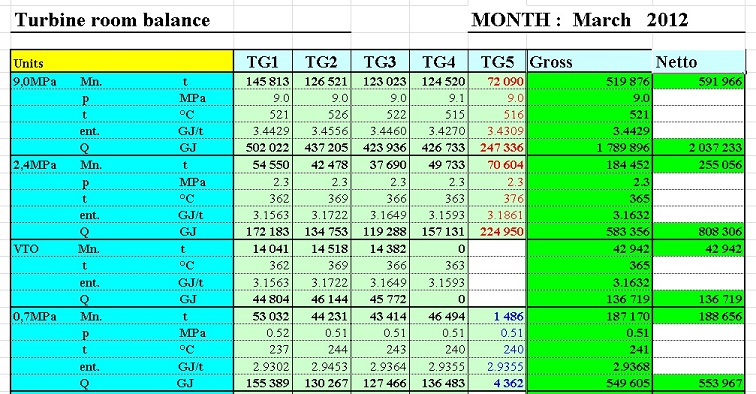
There are about 30 functions enabling one to configure any possible data structure which can be further used by standard Excel functions (graphs, etc.).
Advanced PDIS functions
PDIS contains several included modules and separate programs which are fully integrated with PDIS. They are targeted at several areas of detailed data analysis, data enhancement a process optimization.
Data reconciliation and validation
PDIS is fully integrated with Recon - ChemPlant's program for mass and energy balancing, data reconciliation and validation. Recon can be used during the data import to PDIS database to
- complement raw data in PDIS DB by calculated unmeasured variables on the basis of mass and energy balances and thermodynamic calculations (unmeasured flows, temperatures, heat transfer coefficients, boiler's and turbine's efficiencies, etc.).
- validate measured data as concerns possibility of gross measuring errors. Recon calculates so-called status of data quality which can be used in interpretation of results.
Process simulation
Recon can be run in so-called simulation mode to predict behavior of a plant under changed conditions. Such calculations are inevitable in the process of plant's optimization - to compare a real state with the optimum. Results of simulation can be saved to the PDIS DB.
Data mining
A long term database of validated data contains invaluable information about plant's history, which can be exploited in optimization efforts. PDIS contains a Data mining module enabling one easy and fast creation of statistical (correlation and regression) models. Such models can be used for prediction of plant's behavior under changed conditions. By a few key strokes a user can easily create multiple linear/nonlinear regression models among process variables. Attention is also paid to the statistical analysis of process data and to automatic removal of outliers.
KPI monitoring
KPI monitoring in PDIS is based on a special sort of Score Cards - so-called Technological Cards (Operating Windows). Technological Cards (TCs) are groups of variables belonging to one task. For individual variables there can be set limits and targets in which the variables should be maintained during the optimum and safe operation of a plant. The limits and targets can be either fixed, depending on modes of operation or functions of some control variables. The compatibility of a real plant function with TCs is presented in the following tabular form, where rows represent variables and columns represent time.
It is also possible to create long-term statistics analyzing control of a plant in required limits (influence of outer conditions, individual working shifts, etc.).
Energy Management System EMan
EMan is the information system for
- Monitoring energy consumption
- Analyzing deviations of energy consumption from a plan (target)
- Root Cause Analysis of deviations
- On-line presenting to users
- Reporting
By clicking any of screen objects, the user sees a graphical trend of tags linked to the object (drill down). Data underlying graphs can be exported to an Excel sheet.